Arrhythmias
This chapter will go through different supraventricular tachycardias, ventricular tachycardias, and bradycardia, and how to use the AHA algorithm for treating these. We will first review over the supraventricular tachcardias in the sketch below:

This is our simple sketch of a normal EKG of the heart. Notice the P wave has the letters RA and LA (right atrium and left atrium). Our PR interval figure is measuring the length (his hat says less than 0.2 sec). The QRS guy’s hat says < 0.1 second. And finally, our QT length should be less than 40% of the RR interval.
PR = less than 5 squares. QRS = less than 3 squares. (think about odd numbers). And our QT (cute guy), needs to be smaller than the big tall R wave by 40%.
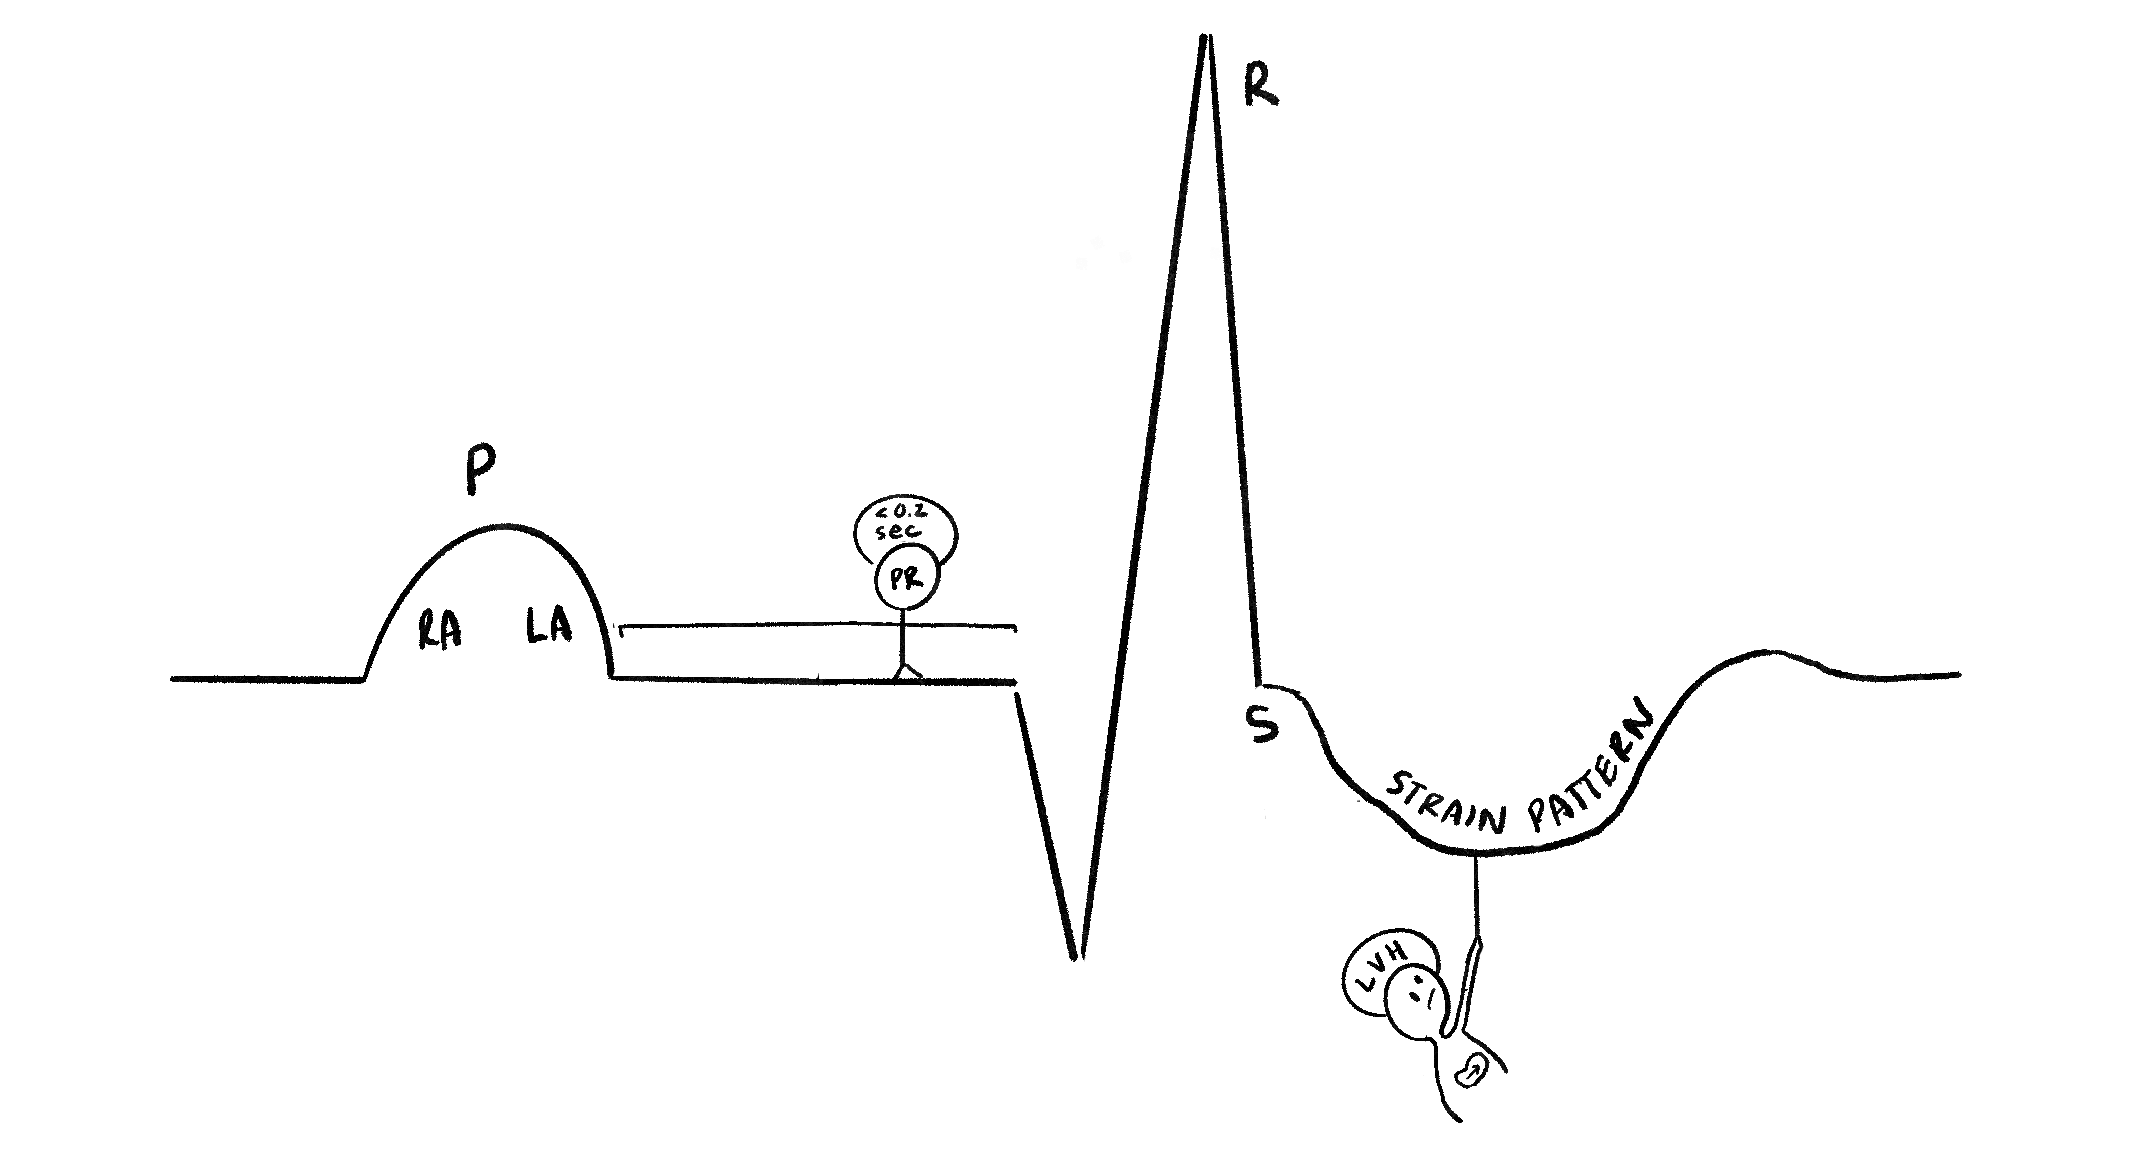
Notice our LVH guy is totally dragging down the ST segment, causing ST depression and an inverted T wave. This is a classic sign of left ventricular strain pattern due to the enlargement of the left ventricle, causing abnormal electrical signaling.
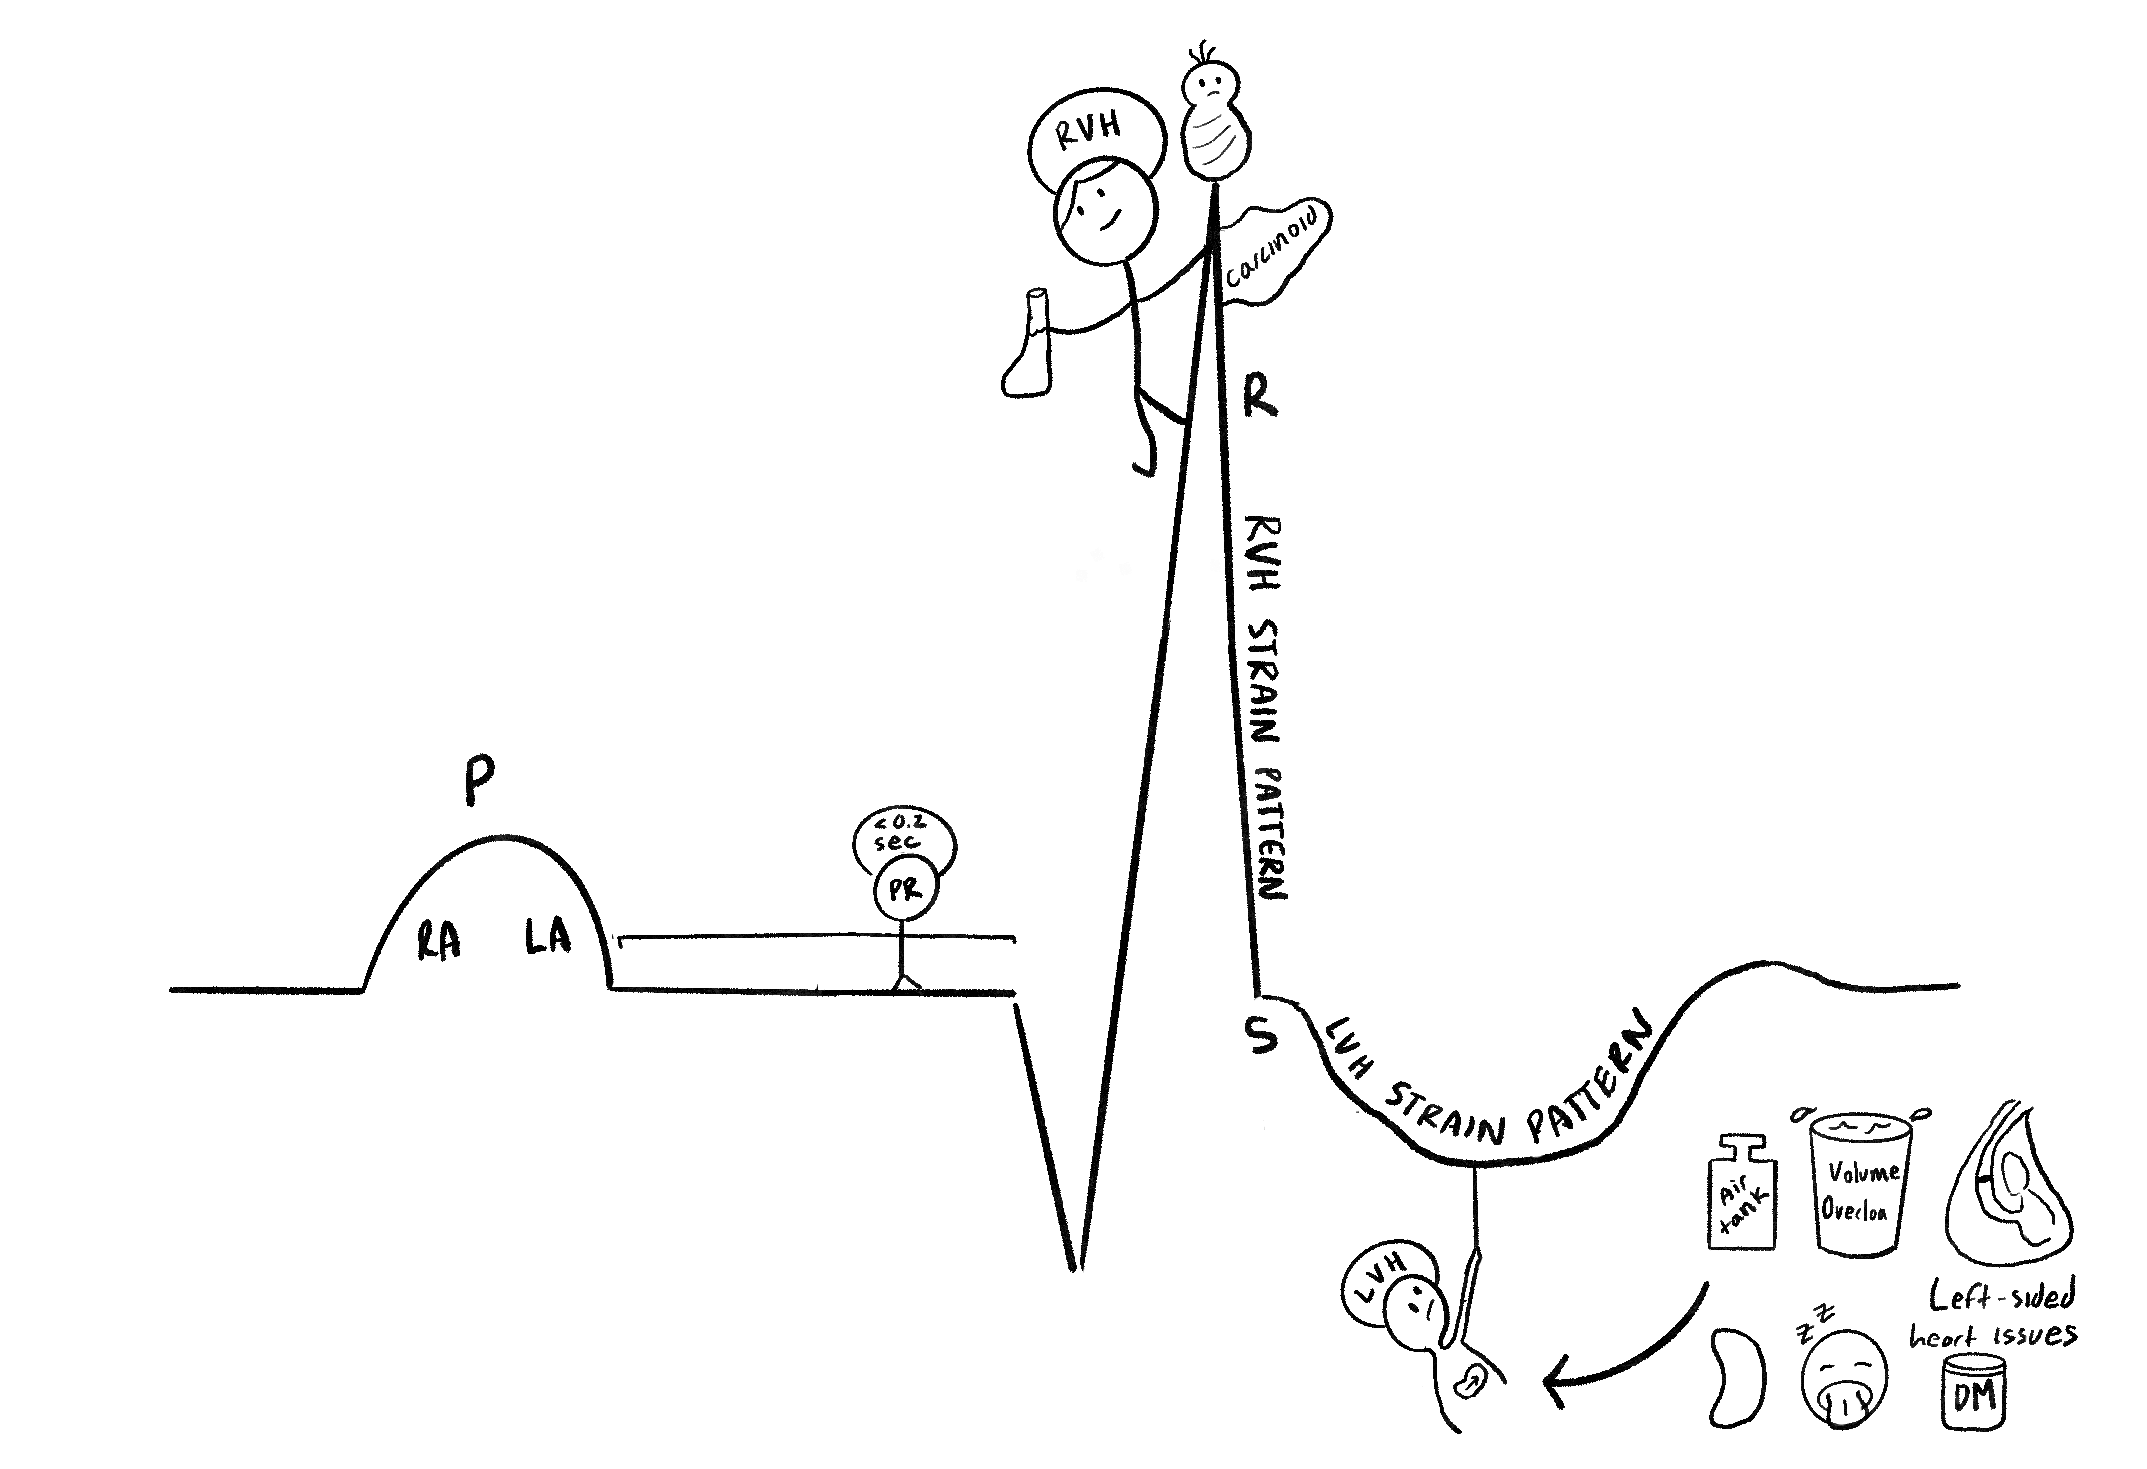
Our LVH guy is caused by a series of things such as hypertension, volume overload, left-sided heart failure, kidney failure, obstructed sleep apnea, and diabetes. Our R wave suddenly got taller thanks to the RVH guy (right ventricular hypertrophy). Notice the lung-shaped glass, baby, and carcinoid tumor (RVH is caused by lung disease, congenital diseases, carcinoid, and any right-sided heart issues).
Elevations of R waves seen in V1 - V3.

This is a summary of the 12-lead EKG. When the depolarization of the action potential is going towards the lead, it creates a positive wave. A depression wave means there is a signal going away. As a result, we notice that the leads more towards the inferior left side are going to have a positive wave, given the path of the heart signaling goes in that direction. Some important things to note are the R progression, where V1 is away from the heart signal, leading to a small R wave. However, as the V1 progresses to V6, the R wave grows taller, which is expected since those leads are more in the direction of heart depolarization. If there are abnormalities to this progression, we may be concerned about possible underlying heart disease.
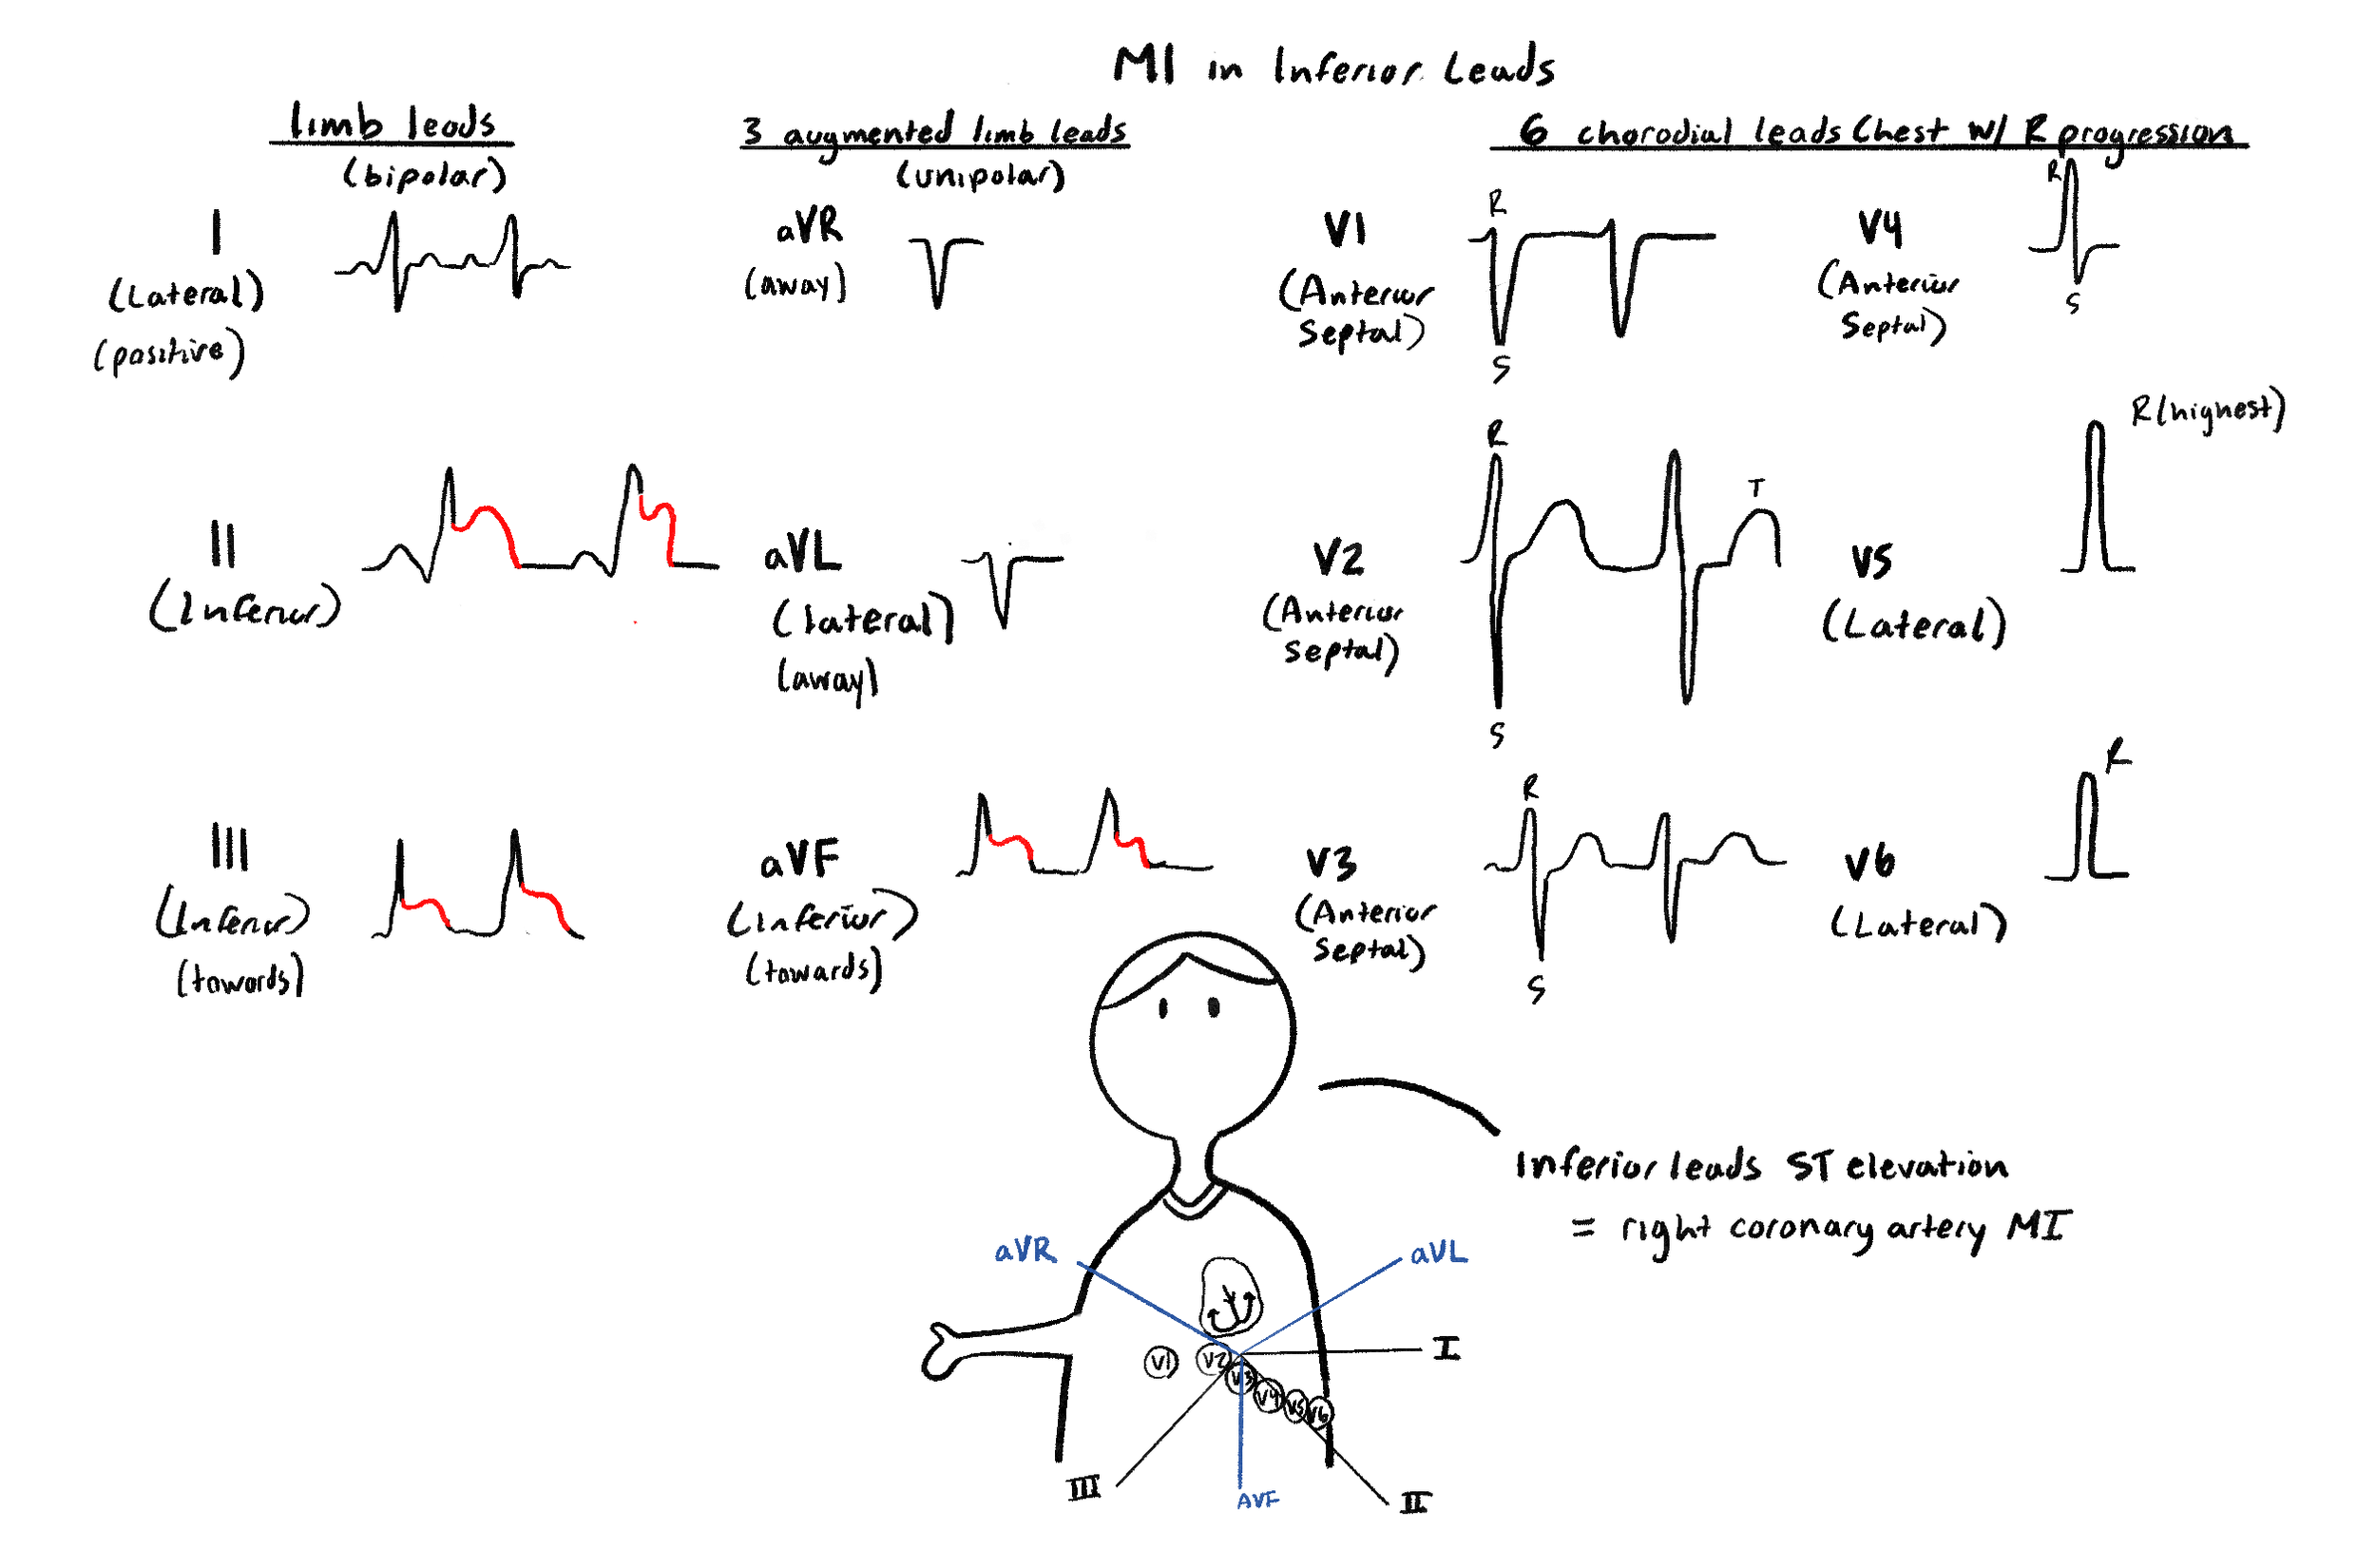
Here we have a myocardial infarction due to blockage of the right coronary artery. We know this because there is ST-segment elevation in the inferior leads (2, 3, and AVF).
Also our guy below is showing us the Einthoven’s triangle. Recall that the up angles are 30 degree above, while the down angles are 60 degrees below. And the angle numbers start with I and go positive clockwise and negative counterclockwise, meaning it goes to 180 and -180 in both directions from lead I.
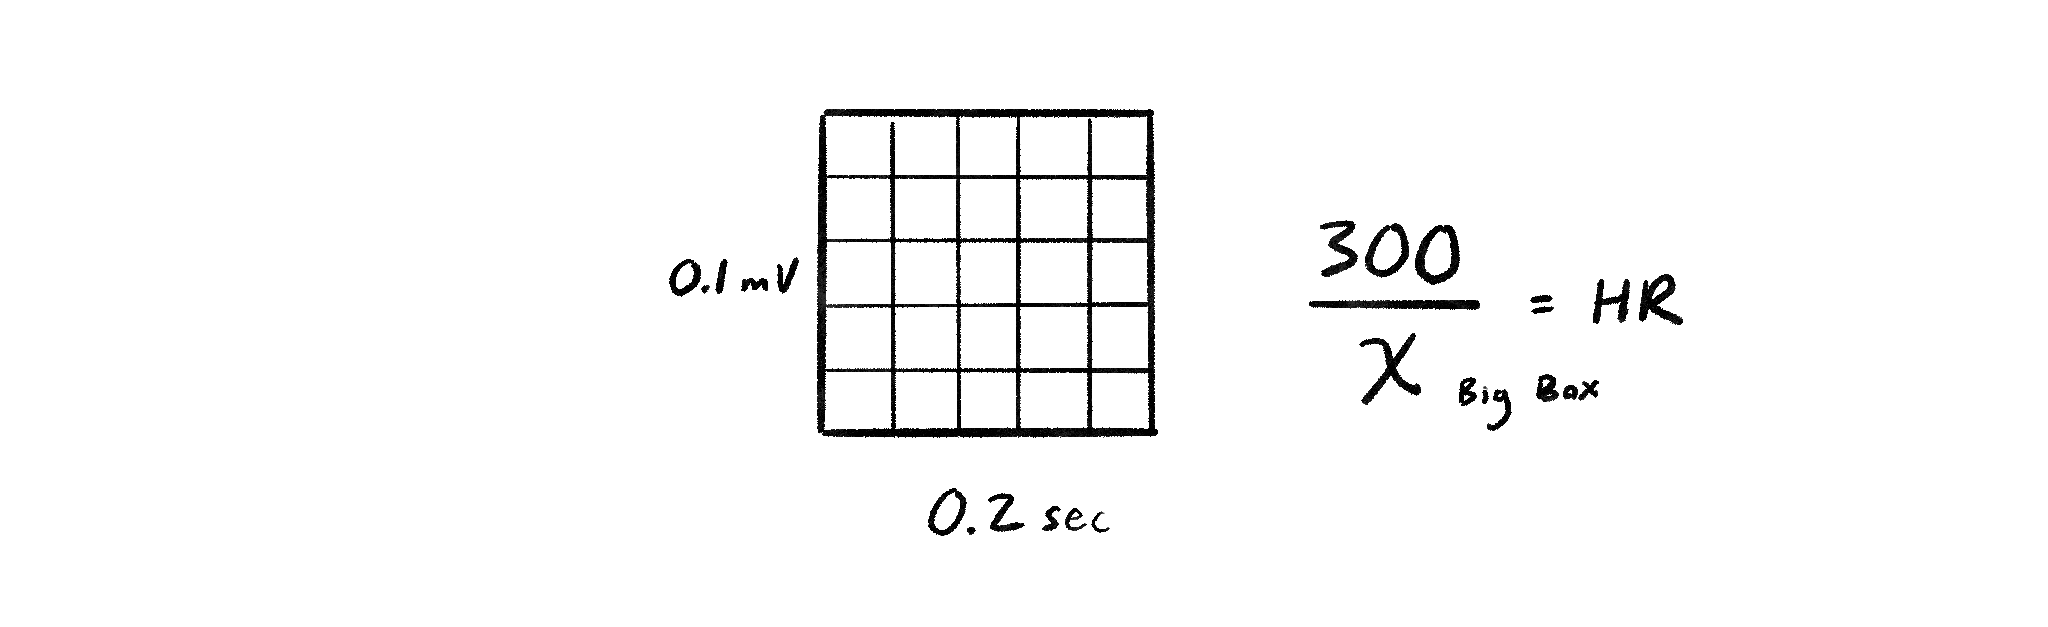
To figure out heart rate, just figure out the number of BIG boxes between the R to R interval. Then take 300 divided by that. Make sure it is big boxes, and not little boxes.